Everyone’s experienced that thing where you’re listening to something, and you think to yourself, “Holy shit does this remind me of fall 2004.” How strongly certain music is correlated with certain periods of your life depends on many things, including but probably not limited to when you first heard it, when you first liked it, and when your listening to it was most highly concentrated. So, for instance, in my case, most Destroyer albums will recall times and places that are vague at best, and that depend mostly upon first exposure rather than concentration — this as a result of the fact that I listen to every Destroyer album all the time, approximately.
Blueboy’s Unisex, on the other hand, will probably always remind me of the winter of 2006-7, as I listened to it for the first time that season, nine additional times within that season (racking up about 150 tracks listened, according to Last.fm), and virtually never again once spring hit.
Ever since I began submitting listening data to Last.fm in November of 2004, I’ve wondered whether I’d ever enjoy direct access to all those numbers. Then came Last.fm Extra Stats, mercifully collecting all my listening data for me in a tab-separated file that can be pulled into Excel and manipulated to my heart’s content. Here, as a small example of the data, are my top ten artists (by tracks listened) from winter 2006-7, along with total listens for each artist (since November 2004) (now that I’m finally getting around to publishing this post, all the following data is very old):
| Winter 2006-7 | ||
|---|---|---|
| Artist | Winter (S) ↓ | Total (T) |
| Trans Am | 163 | 163 |
| Blueboy | 148 | 163 |
| The Lucksmiths | 69 | 105 |
| Ratatat | 50 | 126 |
| The Moldy Peaches | 49 | 51 |
| White Flight | 36 | 41 |
| Television Personalities | 35 | 35 |
| Beach House | 35 | 64 |
| Revolving Paint Dream | 32 | 58 |
| RJD2 | 31 | 52 |
Now for some methodology. We only have two numbers available to us here; let’s call them S (seasonal total) and T (total total). As I said, the psychological impact of a band/record over a given time period depends on both the amount of listening during that period (S) and the percentage of total listening within that period (S/T). Neither figure is good enough on its own; I may have listened to Destroyer 102 times this summer (I did), but that’s insignificant given my 1,500 overall listens. And I may have only listened to The Ladybug Transistor this summer (yielding a 100% concentration), but 3 listens is hardly enough to make an impact.
But, since both figures are positive indicators of impact, we can just multiply them (S2/T). This would give Ladybug Transistor a summer 2007 impact index of 3, and Destroyer, 6.92.
Let’s see how this multiplication affects winter’s top ten artists by tracks played:
| Winter 2006-7 | |||
|---|---|---|---|
| Artist | Winter (S) ↓ | Total (T) | Impact (S2/T) |
| Trans Am | 163 | 163 | 163.00 |
| Blueboy | 148 | 163 | 134.38 |
| The Lucksmiths | 69 | 105 | 45.34 |
| Ratatat | 50 | 126 | 19.84 |
| The Moldy Peaches | 49 | 51 | 47.08 |
| White Flight | 36 | 41 | 31.61 |
| Television Personalities | 35 | 35 | 35.00 |
| Beach House | 35 | 64 | 19.14 |
| Revolving Paint Dream | 32 | 58 | 17.66 |
| RJD2 | 31 | 52 | 18.48 |
Most notably, Ratatat is knocked down a few notches (on account of how consistently I listen to them), The Moldy Peaches go up a few spots — and if we reorder the entire list (of 78 artists) by impact index, a couple more eke into the top ten:
| Winter 10 Impacters | |
|---|---|
| Artist | Impact (S2/T) ↓ |
| Trans Am | 163.00 |
| Blueboy | 134.38 |
| The Moldy Peaches | 47.08 |
| The Lucksmiths | 45.34 |
| Television Personalities | 35.00 |
| White Flight | 31.61 |
| The Six Parts Seven | 24.00 |
| Ratatat | 19.84 |
| Loney, Dear | 19.70 |
| Andrew Bird | 19.31 |
This last table is what we’re really after, theoretically giving us the ten artists who will most strongly remind me of the winter of 2006-7. It seems a bit boring at this point, since it’s pretty close in its results to the standard top-ten-by-listens chart; but the methodology is sound, and under more extreme listening conditions (e.g., a Destroyer obsession), it will prove to be a reliable indicator of impact.
And don’t forget, as time passes and I listen to these artists more, their season-specific impacts will drop. For instance, as things turned out, I listened to Television Personalities heavily over the spring, increasing their T value, and reducing their impact in the above table (which uses old data). As a result of my TVP spring listening, their winter index dropped dramatically from 35 to 7.95 — their spring index, as of October 5, 2007, is 91.95.
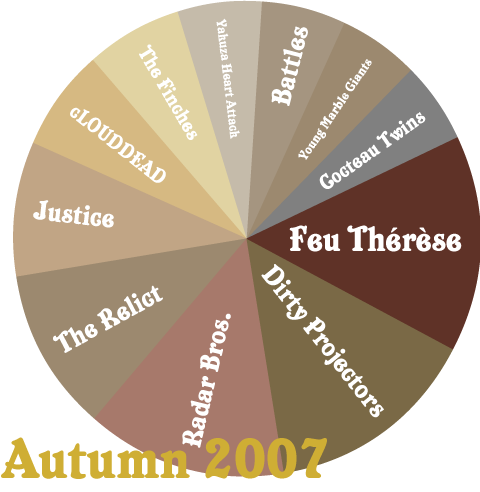
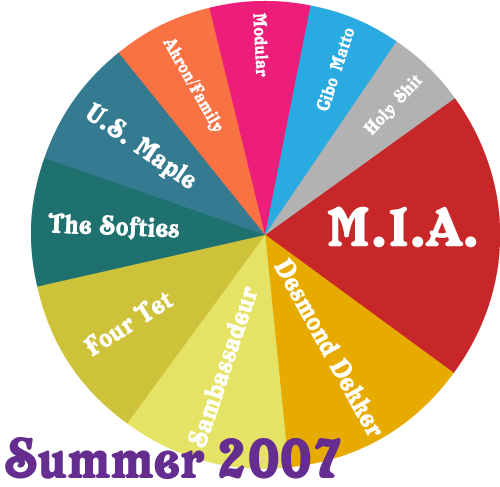
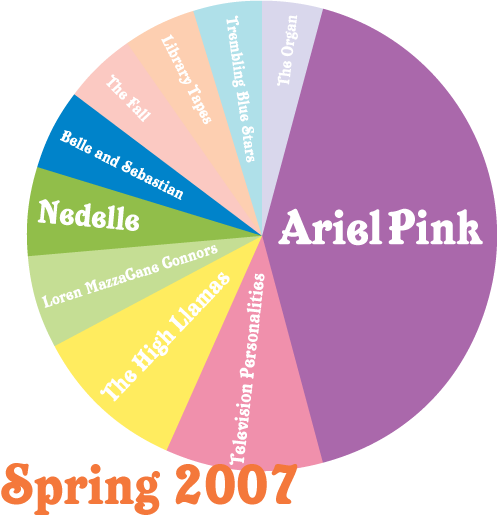
Depicting this analysis visually could go several ways; somehow I want to see a pie chart. Making one from every artist would be impractical, leaving a circle with a hundred or more slivers. Taking the top ten artists feels insensitive to the quirks of any given season; what if I don’t even listen to ten artists that season, for instance? What if I listen to a thousand? I could select only those artists who have indices greater than, say, 20; but this also feels arbitrary and vulnerable to seasonal quirks.
I think a pretty safe threshold above which to choose artists is at 50% of the sum of all impact values. In other words: the sum of the impact indices of winter’s artists is 783. If I take artists off the top of the list until I have half that, I stop after the fourth artist, The Moldy Peaches. Admittedly, a four-sector pie chart is kinda dull, but I need to be consistent in the creation of these charts so that impacts are accurately represented from season to season.
So, roughly…here are what the last three seasons of 2007 “meant” to me:


What I like about these is that they are not only internally consistent, but consistent with each other; Ariel Pink will remind me of the spring of 2007 more than M.I.A. will remind me of the summer, as represented by a larger sector in his season’s pie. I could similarly generate these with a focus on albums, which would be slightly more specific and alter the results dramatically. I know, for instance, that all my summer 2007 listening to M.I.A. was off her new record, songs that necessarily didn’t contribute to any prior M.I.A. listening — so, Kala, were it to have a sector in an album pie, would have one much larger than the less specific “M.I.A.” one.
Granted, there are more than a few problems with this whole endeavor, and here are the major three:
- Last.fm does not track things that I listen to on CD/vinyl. This is a serious problem, as the things I purchase tend to be the things I like the most, and go totally unaccounted for.
- The number of tracks you’ve listened to by an artist is only kind of related to how much time you’ve spent listening to them. 4 tracks can fill 2 CDs (Lift Your Skinny Fists), or you can cram 91 tracks into 40 minutes of music (Irrevocably Overdriven).
- iPod listens are not properly documented. Even if I remember to report them to Last.fm with AudioPod, multiple listens on a single track only get counted as one — this is particularly damaging on long trips, for instance.
The (S2/T) formula may have further applications, as I’ll touch on in a follow-up to my original post about alphabetization and digital music library navigation.
One Response to
Pings